Informal definition
The limit is the behaviour of a function f as x gets closer and closer to a given number c (or as x grows without bounds).
Despite this simple intuitive definition of a limit, the correct definition requires a lot of mathematics and is not simple at all to fully understand. We will not be interested in this: we'll only point out, from time to time, the problems that arise when one tries to formalize this concept. In this site you may find a more traditional treatment of this concept, in Italian.
Consider the following example.
Let D = {x ![]() R | x ≠ 0}, and consider the function
R | x ≠ 0}, and consider the function
![]() (x is in radian, as usual when
dealing with limits). We want to describe its behaviour as
x approaches zero. Note that x=0 is not
allowed for the function (sin0/0 does not make sense,
and for this reason 0 is not in the domain). However it makes
sense to ask: how does the function behave as x gets
closer and closer to zero?.
(x is in radian, as usual when
dealing with limits). We want to describe its behaviour as
x approaches zero. Note that x=0 is not
allowed for the function (sin0/0 does not make sense,
and for this reason 0 is not in the domain). However it makes
sense to ask: how does the function behave as x gets
closer and closer to zero?.

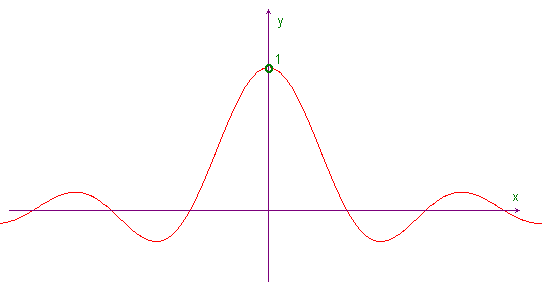
The graph suggests that as x gets closer and closer to zero from either sides (and not reaching zero itself), f(x) approaches 1. This idea can be strengthened if we zoom in on the graph near the point (0,1). We may also use a spreadsheet to make numerical calculations and we'll always obtain the same result: as x gets closer and closer to zero from either sides the values of f approach 1. You can see a list of values obtained with Microsoft Excel.
The standard notation for this fact is ![]() .
Sometimes we also write
.
Sometimes we also write ![]() .
.
Other examples
![]() As the following graph suggests we have
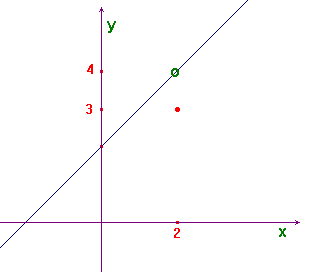
As the following graph suggests we have
![]() , while f(2)=3.
, while f(2)=3.

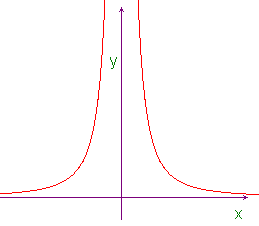
![]() From the graph we can deduce that
From the graph we can deduce that ![]() .
.

From the same graph we can deduce that ![]() .
.
Unfortunately the graph is not always so simple to interpret,
due to obvious limitations in computer graphics. We consider now
a most complicated function: ![]() .
If we try to graph it we obtain something like the following
picture, where we have drawn three different enlargements near
the origin:
.
If we try to graph it we obtain something like the following
picture, where we have drawn three different enlargements near
the origin:

As you can easily see the picture does not help us to understand
what is the behaviour of the function when x approaches
zero. In this case we must use other techniques to investigate
the function's behaviour. For instance we can observe that,
if we change the variable form x to 1/x, all
points between 0 and 1 will have a corresponding point between 1
and +∞: we can interpret the graph of sin(1/x),
between zero and one, as the compression of the graph of
sinx between 1 and +∞. So to find the behaviour
of sin(1/x) as x approaches zero it is
sufficient to investigate the behaviour of sinx as
x approaches +∞; this last behaviour is easy to
figure: sinx fluctuates between -1 and 1 without
approaching any definite value. We write ![]() or, in an equivalent manner,
or, in an equivalent manner, ![]() .
.
It is important to observe that finding the behaviour of a function f as x gets closer and closer to a given number c makes sense only if in the neighbourhood of the point c, possibly not belonging to the domain of f, there are points of the domain of f, otherwise the values of the function cannot be calculated. We shall say that the point c must be an accumulation point for the domain of f: an accumulation point for a set is a point (possibly not belonging to the set) in whose neighbourhoods we can always find points of the set, no matter how the neighbourhood is small.
We can summarize all this in the following:
Informal definition
Suppose we are given a function ![]() ,
and an accumulation point c for D, then we say
that the limit of f(x), as x approaches
c, is l if f(x) gets
arbitrary close to l, when x
is sufficiently close to c.
,
and an accumulation point c for D, then we say
that the limit of f(x), as x approaches
c, is l if f(x) gets
arbitrary close to l, when x
is sufficiently close to c.
We write ![]() or, equivalently,
or, equivalently, ![]() .
.